Table of Contents
Over the last decade, the role of Medicare Advantage, the private plan alternative to traditional Medicare, has grown. In 2021, more than 26 million people are enrolled in a Medicare Advantage plan, accounting for 42 percent of the total Medicare population, and $343 billion (or 46%) of total federal Medicare spending (net of premiums). The average Medicare beneficiary in 2021 has access to 33 Medicare Advantage plans, the largest number of options available in the last decade.
To better understand trends in the growth of the program, this brief provides current information about Medicare Advantage enrollment, including the types of plans in which Medicare beneficiaries are enrolled, and how enrollment varies across geographic areas. A second, companion analysis describes Medicare Advantage premiums, out-of-pocket limits, cost sharing, extra benefits offered, and prior authorization requirements in 2021. A third analysis compares Medicare Advantage plans’ star ratings and federal spending under the quality bonus program.
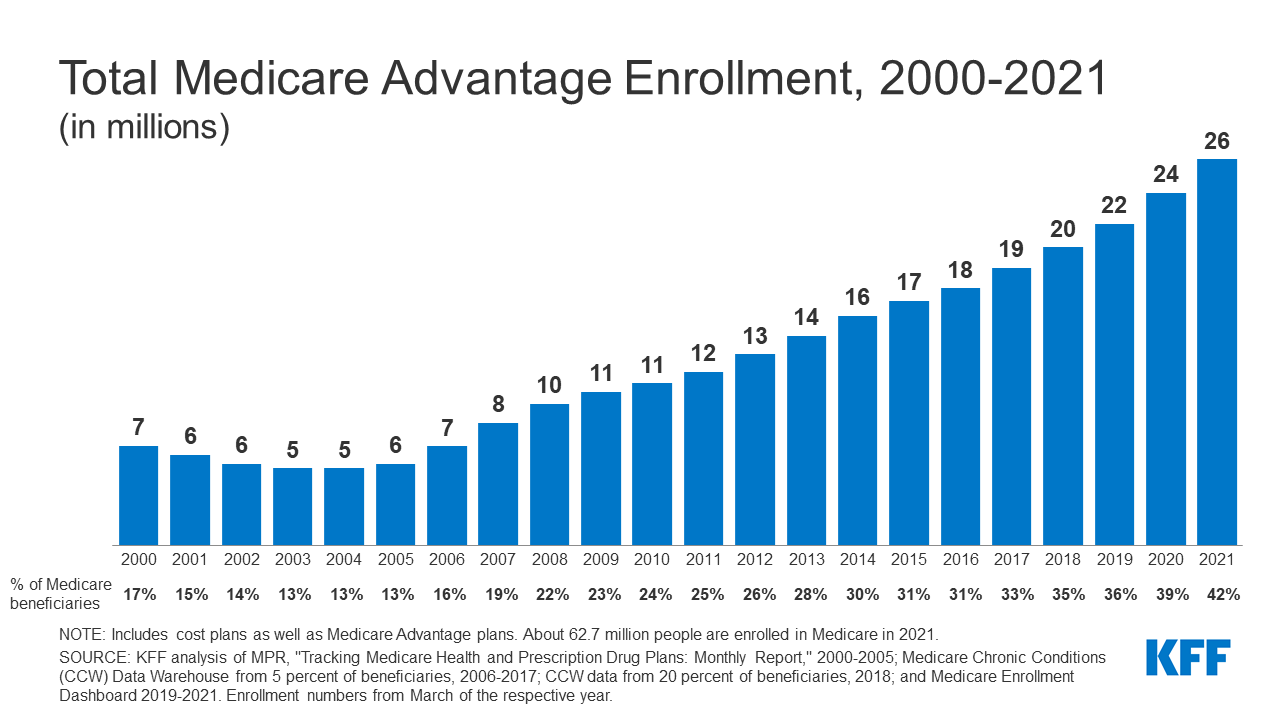
Enrollment in Medicare Advantage has more than doubled over the past decade
In 2021, more than four in ten (42%) Medicare beneficiaries – 26.4 million people out of 62.7 million Medicare beneficiaries overall – are enrolled in Medicare Advantage plans; this share has steadily increased over time since the early 2000s. Between 2020 and 2021, total Medicare Advantage enrollment grew by about 2.4 million beneficiaries, or 10 percent – nearly the same growth rate as the prior year. The Congressional Budget Office (CBO) projects that the share of all Medicare beneficiaries enrolled in Medicare Advantage plans will rise to about 51 percent by 2030 (Figure 2)
In 2021, two-thirds of Medicare Advantage enrollees are in individual plans
Two-thirds (67%) of Medicare Advantage enrollees, or 17.7 million people, are plans generally available for individual enrollment. That is an increase of 1.6 million enrollees compared to 2020. Individual plans have accounted for approximately the same share of total Medicare Advantage enrollment since 2014.
Nearly one in five Medicare Advantage enrollees (19%) are in group plans offered to retirees by employers and unions in 2021
Nearly 4.9 million Medicare Advantage enrollees are in a group plan offered to retirees by an employer or union. While this is roughly the same share of enrollment since 2014 (19%), the actual number has increased from 1.9 million in 2010 to 4.9 million in 2021 (Figure 4). With a group plan, an employer or union contracts with an insurer and Medicare pays the insurer a fixed amount per enrollee to provide benefits covered by Medicare. For example, some states, such as Illinois and Pennsylvania, provide health insurance benefits to their Medicare-eligible retirees exclusively through Medicare Advantage plans. As with other Medicare Advantage plans, employer and union group plans often provide additional benefits and/or lower cost sharing than traditional Medicare. The employer or union (and sometimes the retiree) may also pay an additional premium for these supplemental benefits. Group enrollees comprise a disproportionately large share of Medicare Advantage enrollees in eight states: Alaska (100%), Michigan (45%), Maryland (39%), West Virginia (39%), New Jersey (37%), Wyoming (35%), Illinois (32%), and Kentucky (31%).
Almost 4 million Medicare beneficiaries are enrolled in Special Needs Plans in 2021
Nearly four million Medicare beneficiaries are enrolled in Special Needs Plans (SNPs). SNPs restrict enrollment to specific types of beneficiaries with significant or relatively specialized care needs, or who qualify because they are eligible for both Medicare and Medicaid. The majority of SNP enrollees (88%) are in plans for beneficiaries dually eligible for Medicare and Medicaid (D-SNPs). Another 10 percent of SNP enrollees are in plans for people with severe chronic or disabling conditions (C-SNPs) and 2 percent are in plans for beneficiaries requiring a nursing home or institutional level of care (I-SNPs).
While D-SNPs are designed specifically for dually-eligible beneficiaries, 1.5 million Medicare beneficiaries with Medicaid were enrolled in non-SNP Medicare Advantage plans in 2019 (the most recent year for which this data is available).
Enrollment in SNPs increased from 3.3 million beneficiaries in 2020 to 3.8 million beneficiaries in 2021 (15% increase), and accounts for about 15% of total Medicare Advantage enrollment in 2021, up from 11% in 2010, with some variation across states. In the District of Columbia and Puerto Rico, SNPs comprise about half of all Medicare Advantage enrollees (54% in DC and 47% in PR). In eight states, SNP enrollment accounts for about one-fifth of Medicare Advantage enrollment (25% in NY, 23% in LA and in MS, 22% in SC and in GA, 21% in AR and in FL, and 20% in TN). Nearly 95% of C-SNP enrollees (about 362,000 people) are in plans for people with diabetes or cardiovascular conditions in 2021. Enrollment in I-SNPs has been increasing but slightly declined in 2021 and is still fewer than 100,000.
The share of Medicare beneficiaries in Medicare Advantage plans, by state, ranges from 1% to over 50%, and varies substantially within states
The share of Medicare beneficiaries in Medicare Advantage plans varies across the country. At least 50 percent of Medicare beneficiaries are enrolled in Medicare Advantage plans in two states (MN, FL) and Puerto Rico. Puerto Rico has the highest Medicare Advantage penetration, with 80 percent of Medicare beneficiaries enrolled in a Medicare Advantage plan. Additionally, in 24 states, at least 40 percent of Medicare beneficiaries are enrolled in Medicare Advantage plans (AL, MI, HI, OR, WI, CT, GA, PA, ME, LA, CO, NY, CA, OH, TX, AZ, TN, RI, NC, NV, MO, UT, KY, NM). Medicare Advantage enrollment is relatively low (less than 20 percent) in four states, Vermont, Maryland, and two mostly rural states where it is virtually non-existent (AK and WY).
Within states, the share of Medicare beneficiaries enrolled in Medicare Advantage varies substantially across counties. For example, in Florida, 51% of all Medicare beneficiaries in the state are enrolled in Medicare Advantage, and the share by county ranges from 16% in Monroe County (Key West) to 73% in Miami-Dade County. In Ohio, 45% of all Medicare beneficiaries are enrolled in Medicare Advantage, with the share by county ranging from 27% in Mercer County (Celina) to 58% in Stark County (Canton). To explore this variation, click on a state on the map in Figure 6.
Historically, the majority of Medicare private health plan enrollment in Minnesota has been in cost plans, which are not Medicare Advantage plans, but are a type of Medicare health coverage that has some of the same rules as Medicare Advantage plans, and are offered in limited areas of the country. However, as of 2019, most cost plans in Minnesota are no longer offered and have been replaced with risk-based HMOs and PPOs. In 2021, cost plans represent about 11% of Medicare Advantage enrollment in Minnesota.
Nearly three in ten Medicare beneficiaries live in a county where more than half of Medicare beneficiaries in that county are enrolled in a Medicare Advantage plan
In 2021, 29 percent of all Medicare beneficiaries live in a county where more than half of Medicare beneficiaries in that county are enrolled in Medicare Advantage plans (446 counties). That is substantially more than in 2010 when just 4 percent of the Medicare population lived in a county where more than 50 percent of Medicare beneficiaries were enrolled in a Medicare Advantage plan (109 counties). Many counties with high Medicare Advantage penetration are centered around relatively large, urban areas, such as Monroe County, NY (71%), which includes Rochester, and Allegheny County, PA (64%), which includes Pittsburgh.
In contrast, in 383 counties, accounting for 2 percent of Medicare beneficiaries, no more than 10 percent of beneficiaries are enrolled in private Medicare plans; many of these low penetration counties are in rural parts of the country. However, some urban areas, such as Baltimore City, MD (27%), Charleston, SC (27%), and Cook County, IL (Chicago, 31%) have low Medicare Advantage enrollment, compared to the national average (42%).
To see how Medicare Advantage penetration has changed over time and to highlight counties with at least a minimum share of beneficiaries enrolled in Medicare Advantage, select a Medicare Advantage penetration level and adjust the year using the slider in Figure 7.
UnitedHealthcare and Humana account for nearly half of all Medicare Advantage enrollees nationwide in 2021
Medicare Advantage enrollment is highly concentrated among a small number of firms. UnitedHealthcare and Humana together account for 45 percent of all Medicare Advantage enrollees nationwide, and the BCBS affiliates (including Anthem BCBS plans) account for another 14 percent of enrollment in 2021. Four firms (CVS Health, Kaiser Permanente, Centene, and Cigna) account for another 23 percent of enrollment in 2021.
UnitedHealthcare and Humana have consistently accounted for a large share of Medicare Advantage enrollment
UnitedHealthcare has had the largest share of Medicare Advantage enrollment since 2010. Its share of Medicare Advantage enrollment has grown from 19 percent in 2010 to 27 percent in 2021. Humana has also had a high share of Medicare Advantage enrollment, though its share of enrollment has grown more slowly, from 16 percent in 2010 to 18 percent in 2021. BCBS plans share of enrollment has moderately declined over the years, initially rising from 15 percent in 2010 to 17 percent in 2011, but then declining to 14 percent in 2021. CVS Health, which purchased Aetna in 2018, has seen its share of enrollment nearly double from 6 percent in 2010 to 11 percent in 2021. Kaiser Permanente has seen its share of enrollment moderately decline, from 9% in 2010 to 7% in 2021. The largest decline has been for all other insurers (insurers that have less than 2 percent of enrollment), which has dropped from 26 percent in 2010 to 17 percent in 2021.
For the fifth year in a row, enrollment in UnitedHealthcare’s plans grew more than any other firm, increasing by more than 854,000 beneficiaries between March 2020 and March 2021. Humana’s increase in plan year enrollment was about half of UnitedHealthcare’s, with an increase of about 395,000 beneficiaries between March 2020 and March 2021. BCBS affiliates had the third largest growth in plan enrollment with an increase of about 305,000 between March 2020 and March 2021. CVS Health, which purchased Aetna in 2018, had the fourth largest growth in Medicare Advantage enrollment in 2021, increasing by about 242,000 beneficiaries between March 2020 and March 2021.
Discussion
Medicare Advantage enrollment has steadily increased both nationally and within most states since 2005, with more than 40 percent of Medicare beneficiaries enrolled in Medicare Advantage plans in 2021. The share of Medicare Advantage enrollees varies across the country: in 26 states and Puerto Rico, at least 40 percent of Medicare beneficiaries are enrolled in Medicare Advantage plans in 2021, and at least 50 percent in Florida, Minnesota and Puerto Rico. In a growing number of counties, more than half of all Medicare beneficiaries are in a Medicare Advantage plan, in lieu of traditional Medicare. Enrollment continues to be highly concentrated among a handful of firms, both nationally and in local markets, with UnitedHealthcare and Humana together accounting for 45 percent of enrollment in 2021.
As Medicare Advantage takes on an even larger presence in the Medicare program, and as the Medicare Hospital Insurance Trust Fund is currently projected to be insolvent by 2026, it will be increasingly important to assess how well Medicare’s current payment methodology for Medicare Advantage is working to enhance efficiency and hold down beneficiary costs and Medicare spending. It will also be important to monitor how well beneficiaries are being served in both Medicare Advantage and traditional Medicare, in terms of costs, benefits, quality of care, patient outcomes, and access to providers, with particular attention to those with the greatest needs.
Meredith Freed, Jeannie Fuglesten Biniek, Tricia Neuman are with KFF.
Anthony Damico is an independent consultant.
| This analysis uses data from the Centers for Medicare & Medicaid Services (CMS) Medicare Advantage Enrollment, Benefit and Landscape files for the respective year. KFF is now using the Medicare Enrollment Dashboard for enrollment data, from March of each year.
In previous years, KFF has used the Medicare Advantage Penetration Files to calculate the number of Medicare beneficiaries eligible for Medicare. The Medicare Advantage Penetration Files includes people who were previously, but no longer covered by Medicare (e.g., people who obtained employer-sponsored health insurance coverage after initially enrolling in Medicare). It also includes people within 5 months of their 65th birthday, but not yet age 65. In addition, CMS identified an issue where beneficiaries with multiple addresses were double counted in the Penetration File. KFF refined its approach last year and is using the Medicare Enrollment Dashboard to calculate the number of Medicare beneficiaries because it only includes Medicare beneficiaries with either Part A or Part B coverage, which is a more accurate estimate of the Medicare population. This analysis uses the term Medicare Advantage to refer to Medicare Advantage plans and other types of private plans, including cost and PACE plans. However, MMPs are excluded from this analysis. Enrollment counts in publications by firms operating in the Medicare Advantage market, such as company financial statements, might differ from KFF estimates due to inclusion or exclusion of certain plan types, such as SNPs or employer plans. |
